Xmaster (XHMaster) MT5 公式指标 | Xmaster (XHMaster) Formula Indicator for MT5

Xmaster 公式指示器结合了Moving Average(MA) 和 MACD 来识别趋势强度和方向。 Xmaster Formula Metatrader 5 指标使用绿色和红色箭头为交易者提供入场信号。
TradingFinder 开发团队的一名成员表示:
“一些用户错误地搜索XHmaster而不是Xmaster(专为市场趋势识别而设计)。这个错误导致一些人对其功能和可访问性感到困惑。该工具的正确名称是Xmaster。”
Xmaster配方规格表
规格Xmaster Formula Indicator如下表所示:
| 指标类别: | 振荡器 MT5 指标 MT5 波动率指标 波段和通道 MT5 指标 |
| Platforms: | MetaTrader 5 指标 |
| Trading Skills: | Elementary |
| Indicator Types: | 反转 MT5 指标 |
| Timeframe: | 多时间框架 MT5 指标 |
| Trading Style: | 日内 MT5 指标 |
| 交易工具: | 外汇 MT5 指标 加密货币 MT5 指标 库存 MT5 指标 商品 MT5 指标 指数 MT5 指标 远期 MT5 指标 股票 MT5 指标 |
Xmaster公式代码
以下是MT5的Xmaster(XHMaster)公式代码的一部分:
提供的代码旨在用于教育目的,以演示概念和逻辑,而不是最终或即用版本。
//+------------------------------------------------------------------+
//| X大师公式|
//|版权所有 © tradefinder.com 2023 -2025 |
//+------------------------------------------------------------------+
#property 指标_单独_窗口
#property indicator_buffers 6
#property indicator_plots 4
#property indicator_color1 clrLime
#property indicator_color2 clrRed
#property indicator_color3 clrYellow
#property indicator_color4 clrYellow

#include <MovingAverages.mqh>

// === Inputs ===
input bool alert_on     = true;
input bool alert_sound  = false;
input bool alert_email  = false;

// === Buffers ===
double tmp[], line[], green_line[], red_line[], up_arrow[], down_arrow[];

// === 全局变量 ===
int period1 = 40;
int period2, period3, ma1_handle, ma2_handle, digs;
ENUM_MA_METHOD ma_method = MODE_SMMA;
ENUM_APPLIED_PRICE applied_price = PRICE_LOW;
datetime last_alert = 0;
int stoploss_points = 200;

//+------------------------------------------------------------------+
//|初始化 |
//+------------------------------------------------------------------+
int OnInit() {
   IndicatorSetString(INDICATOR_SHORTNAME, 《X大师公式》);
   SetIndexBuffer(0, green_line, INDICATOR_DATA); PlotIndexSetInteger(0, PLOT_DRAW_TYPE, DRAW_ARROW); PlotIndexSetInteger(0, PLOT_ARROW, 108);
   SetIndexBuffer(1, red_line, INDICATOR_DATA);   PlotIndexSetInteger(1, PLOT_DRAW_TYPE, DRAW_ARROW); PlotIndexSetInteger(1, PLOT_ARROW, 108);
   SetIndexBuffer(2, up_arrow, INDICATOR_DATA);   PlotIndexSetInteger(2, PLOT_DRAW_TYPE, DRAW_ARROW); PlotIndexSetInteger(2, PLOT_ARROW, 225); PlotIndexSetInteger(2, PLOT_LINE_WIDTH, 5);
   SetIndexBuffer(3, down_arrow, INDICATOR_DATA); PlotIndexSetInteger(3, PLOT_DRAW_TYPE, DRAW_ARROW); PlotIndexSetInteger(3, PLOT_ARROW, 226); PlotIndexSetInteger(3, PLOT_LINE_WIDTH, 5);
   SetIndexBuffer(4, line, 指标计算);
   SetIndexBuffer(5, tmp, 指标计算);
   for(int i=0; i<6; i++) PlotIndexSetInteger(i, PLOT_DRAW_BEGIN, period1+1);

   period2 = MathFloor(period1 / 1.9);
   period3 = (int)MathFloor(MathSqrt(period1));
   digs = Digits();
   ma1_handle = iMA(_Symbol, _Period, period1, 0, ma_method, applied_price);
   ma2_handle = iMA(_Symbol, _Period, period2, 0, ma_method, applied_price);
   return INIT_SUCCEEDED;
}

//+------------------------------------------------------------------+
//|主计算循环 |
//+------------------------------------------------------------------+
int OnCalculate(const int rates_total, const int prev_calculated,
                const datetime time[], const double open[],
                const double high[], const double low[], const double close[],
                const long tick_volume[], const long volume[], const int spread[]) {

   int st = prev_calculated > 0 ? prev_calculated - 1 : 1;
   for(int i = st; i < rates_total; i++) {
      green_line[i] = red_line[i] = up_arrow[i] = down_arrow[i] = EMPTY_VALUE;
      double ma1[], ma2[];
      if(CopyBuffer(ma1_handle, 0, rates_total-1-i, 1, ma1) < 1 || CopyBuffer(ma2_handle, 0, rates_total-1-i, 1, ma2) < 1) continue;

      tmp[i] = 2 * ma2[0] - ma1[0]; // Custom MA logic
      line[i] = i > 50 ? SmoothedMA(i, period3, line[i-1], tmp) : tmp[i];

      if(line[i] > line[i-1]) green_line[i] = line[i];
      if(line[i] < line[i-1]) red_line[i] = line[i];

      // 信号检测报警逻辑
      if(green_line[i] != EMPTY_VALUE  green_line[i-1] == EMPTY_VALUE) {
         up_arrow[i] = line[i];
         if(iTime(_Symbol, _Period, 0) != last_alert) {
            last_alert = iTime(_Symbol, _Period, 0);
            double entry = SymbolInfoDouble(_Symbol, SYMBOL_ASK);
            string msg = “Xmaster 购买:” + _Symbol + " @ " + DoubleToString(entry, digs);
            if(alert_on) Alert(msg); if(alert_email) SendMail("Xmaster", msg); if(alert_sound) PlaySound(“警报.wav”);
         }
      }

      if(red_line[i] != EMPTY_VALUE  red_line[i-1] == EMPTY_VALUE) {
         down_arrow[i] = line[i];
         if(iTime(_Symbol, _Period, 0) != last_alert) {
            last_alert = iTime(_Symbol, _Period, 0);
            double entry = SymbolInfoDouble(_Symbol, SYMBOL_BID);
            string msg = “Xmaster 卖出:” + _Symbol + " @ " + DoubleToString(entry, digs);
            if(alert_on) Alert(msg); if(alert_email) SendMail("Xmaster", msg); if(alert_sound) PlaySound(“警报.wav”);
         }
      }
   }
   return rates_total;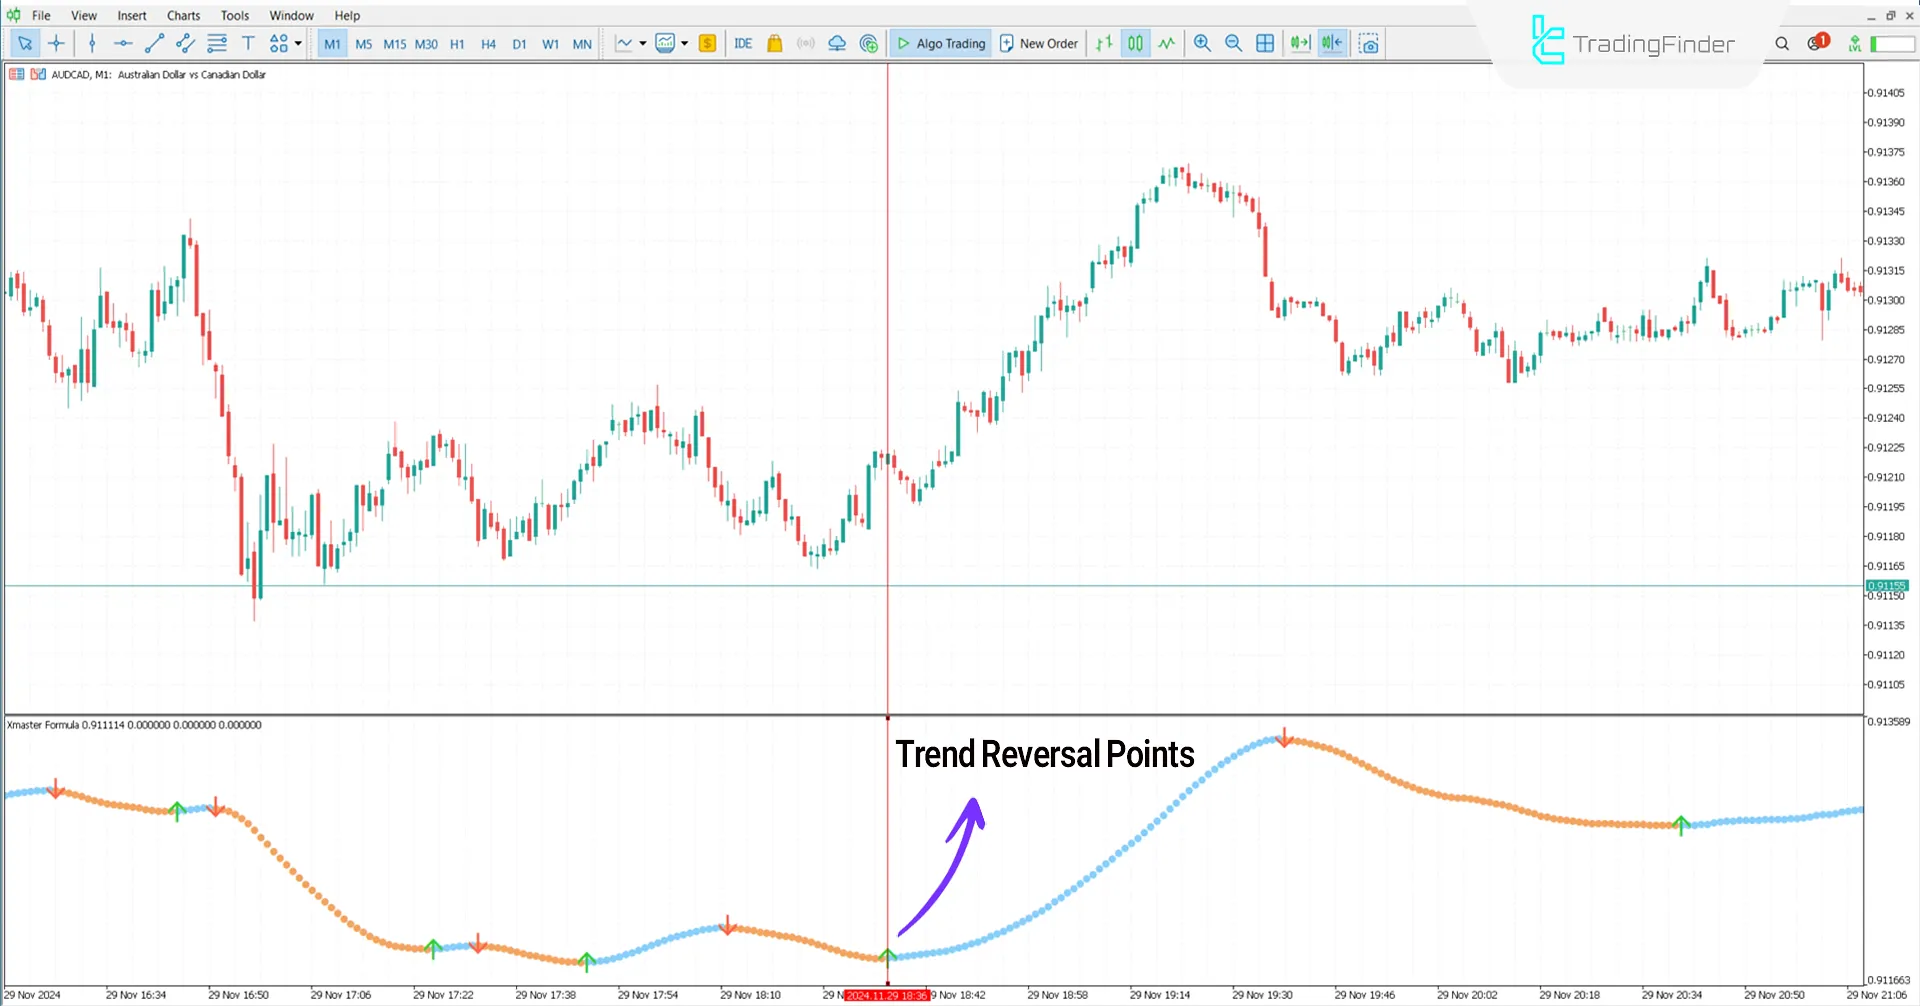
}Uptrend Conditions
澳元/美元 1 分钟时间范围内的价格图表如下所示。绿色arrow signals短期趋势反转,表明看涨信号。
在这种情况下,交易者可以使用绿色箭头作为入场信号来开立买入头寸。
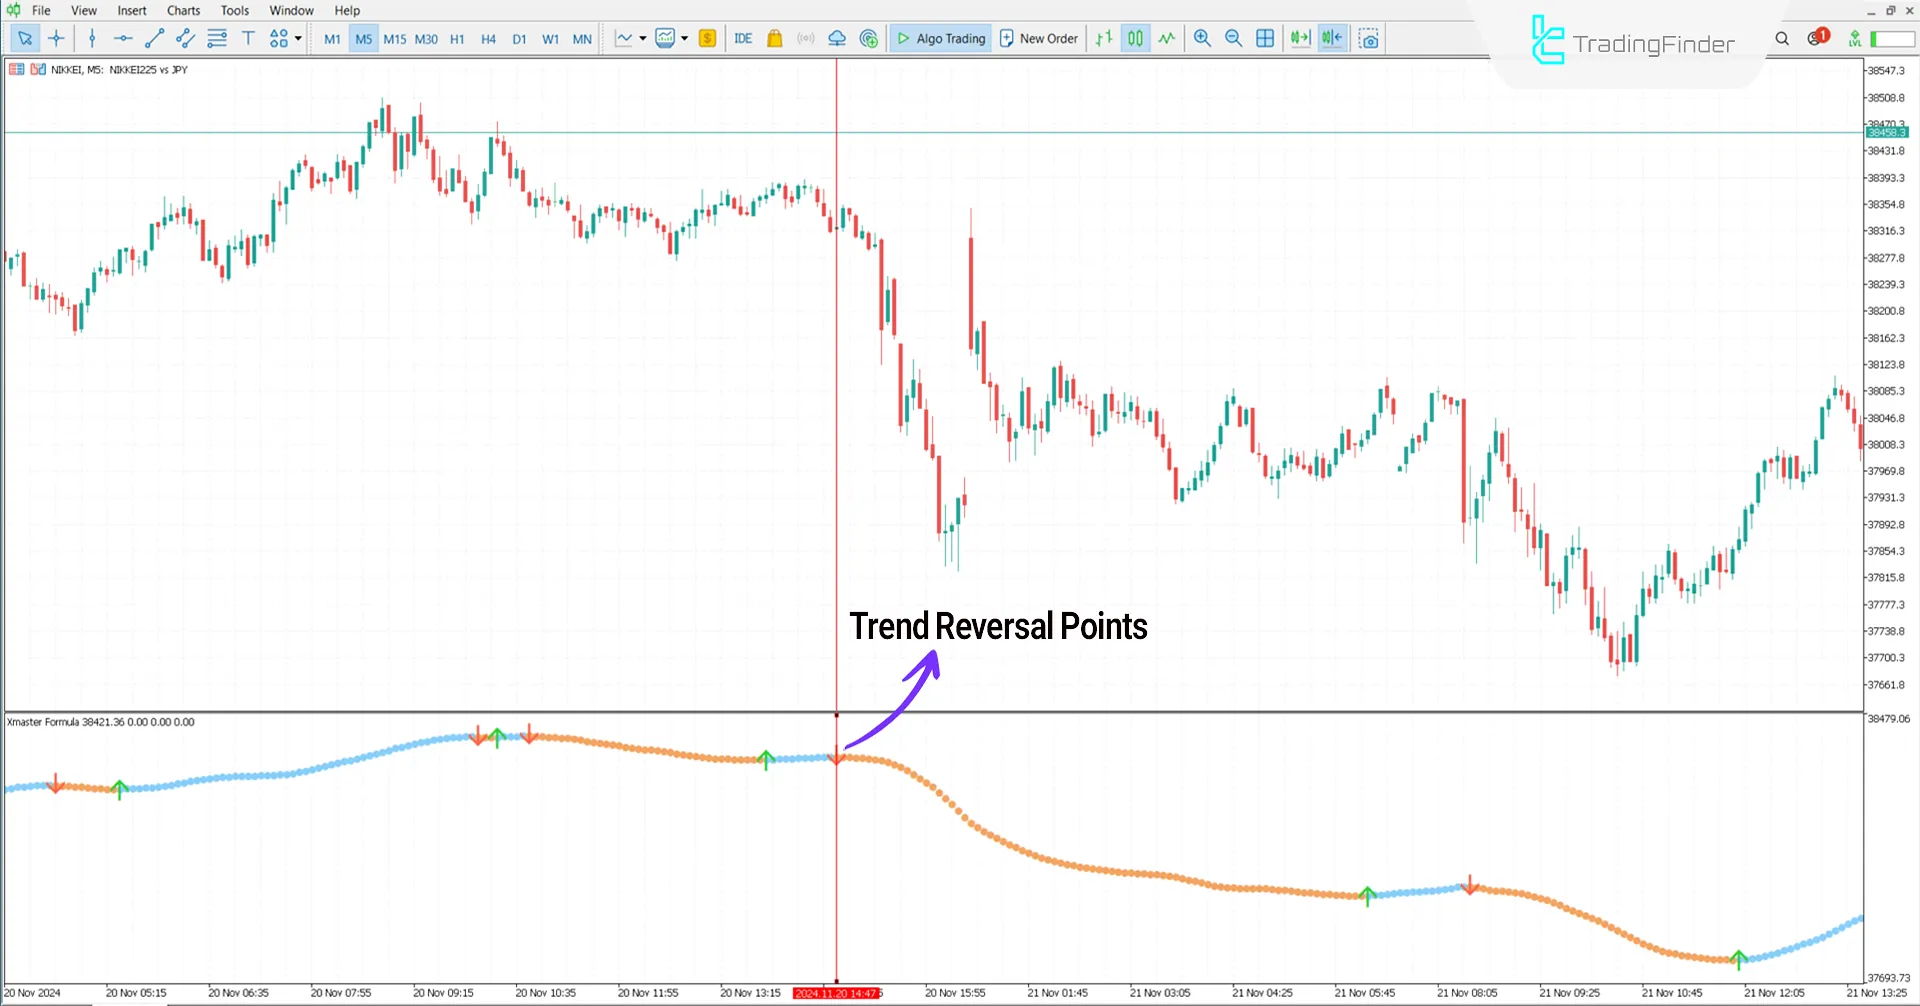
下降趋势条件
下面的价格图表显示了 5 分钟时间范围内的日经 225 指数 (NIKKEI)。
红色箭头表示趋势反转和看跌信号,允许交易者进入Sell position.
Indicator Settings
下图显示了修改和settings Formula Xmaster 指标:
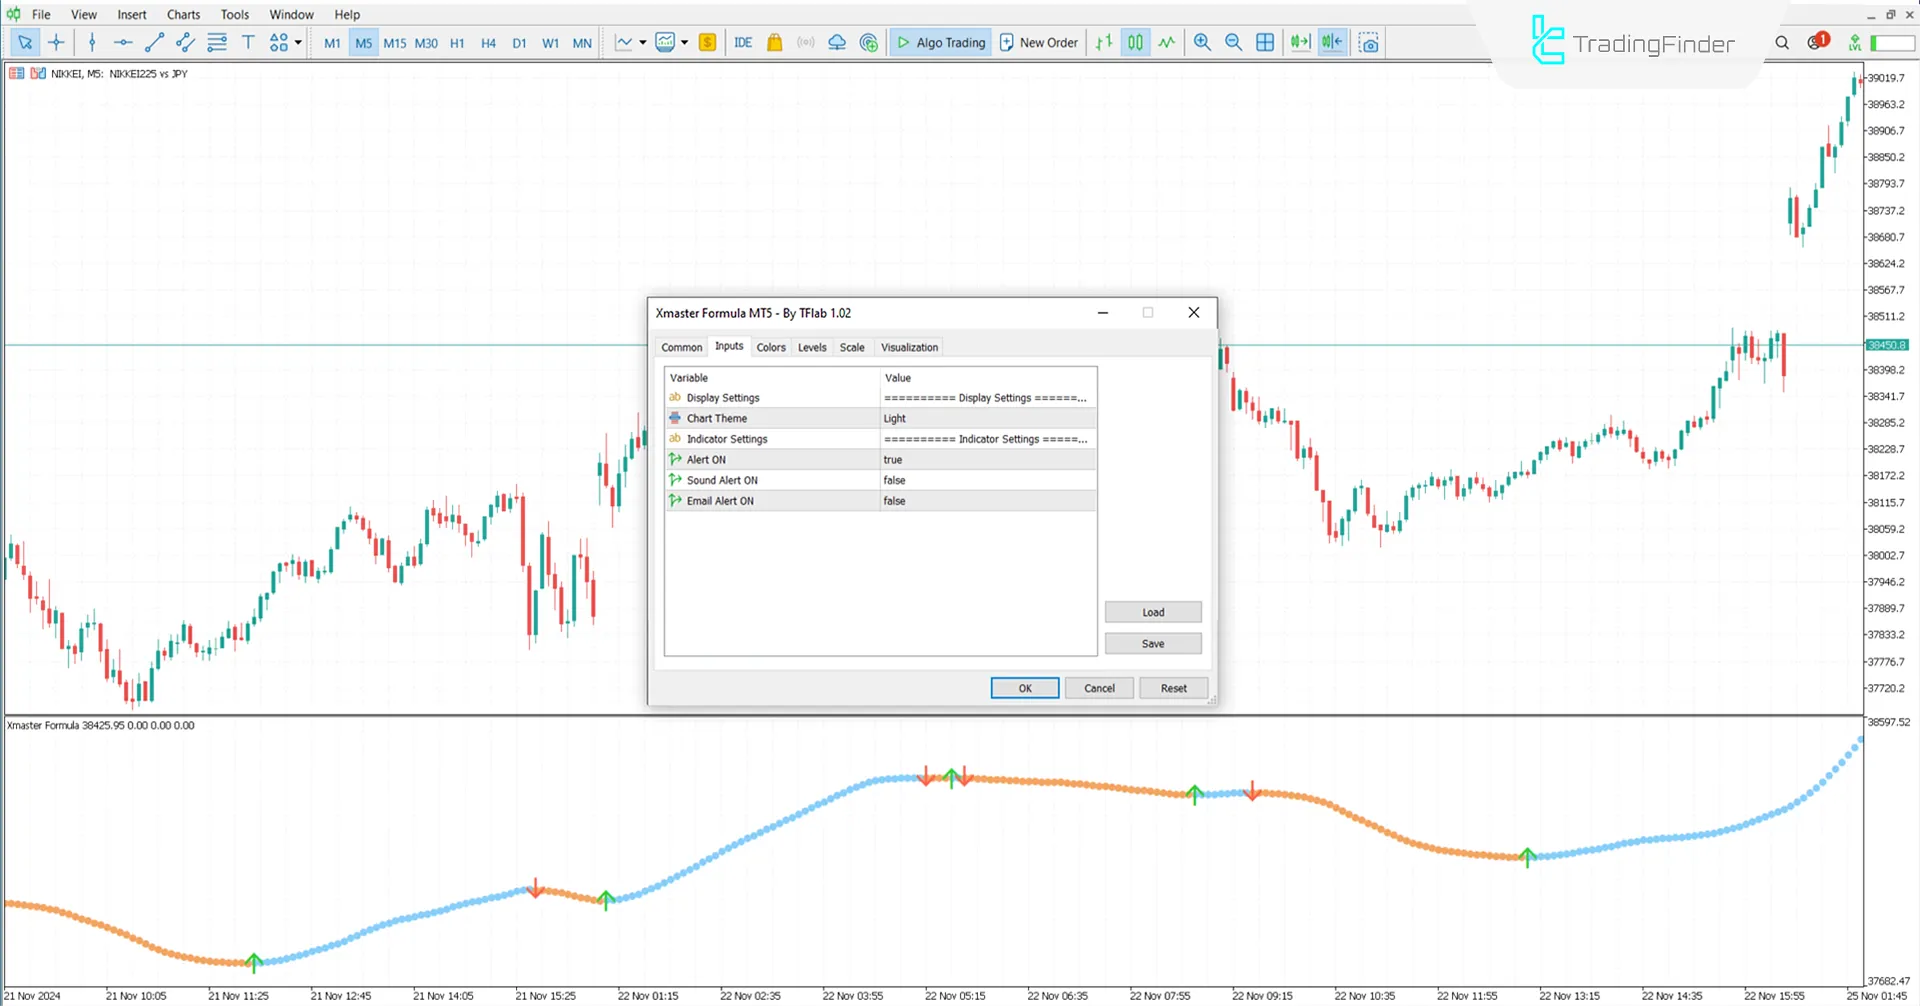
- Chart theme: Chart theme
- Alert on: Enable alerts
- Alert sound: Sound alert
- Alert email: Email alert
Conclusion
The Xmaster(XHMaster)公式该指标结合了两种强大的工具(MA 和 MACD)来识别趋势并找到交易的切入点。
该工具在波动的市场中表现良好,为交易者提供可靠的信号。值得一提的是,XMaster 公式指标 MetaTrader 4 可以在交易中有效使用。
(5)
💡 精彩内容推荐
✍️ 楼主最新发布
- •
- •
- •
- •
- •
- •
🔗 您可能感兴趣
- •
- •
- •
- •
- •
- •
🔐
请登录后参与评论
注册满12小时后评论,即可解锁附件下载
立即登录
