Exp_RSI_Histogram - expert for MetaTrader 5

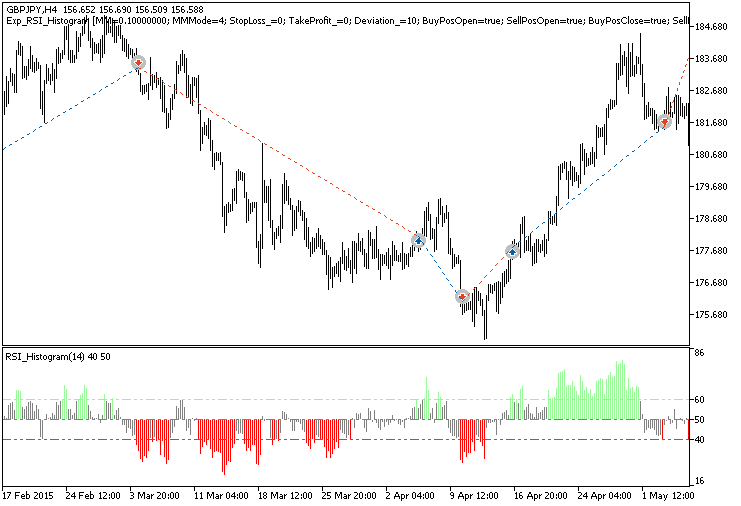

基于信号的交易系统RSI_直方图指标。 A trade signal is generated at the close of a bar if the color of the histogram has changed from a neutral gray to red or lime, i.e. when the RSI oscillator has entered the overbought or oversold zone.
The Expert Advisor uses the compiled indicator file RSI_Histogram.ex5 for operation.将其保存到 <终端数据文件夹>\MQL5\Indicators。
请注意,TradeAlgorithms.mqh 库文件允许将 EA 交易与提供以下服务的经纪商一起使用非零价差以及设置止损和止盈的选项开仓期间。您可以通过以下链接下载该库的更多变体:交易算法。
测试期间已使用默认 EA 交易的输入参数,如下所示。 测试期间未使用止损和止盈。
图 1. 图表上的交易示例
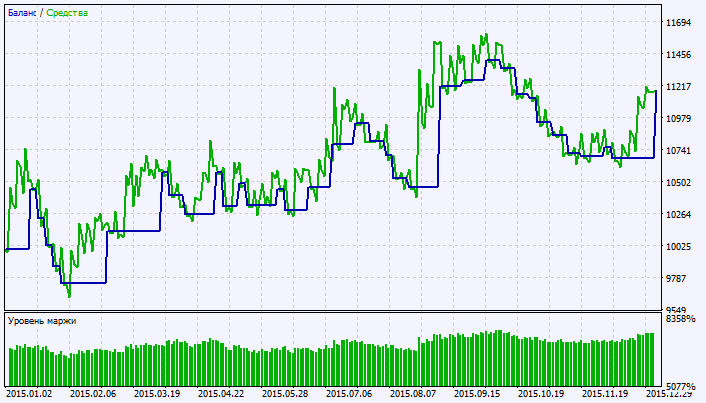
2015 年 GBPJPY H4 测试结果:
图2. 测试结果图表
附件下载
📎 tradealgorithms.mqh (60.9 KB)
📎 rsi_histogram.mq5 (6.87 KB)
📎 exp_rsi_histogram.mq5 (6.61 KB)
Source: MQL5 #14951
💡 精彩内容推荐
✍️ 楼主最新发布
- •
- •
- •
- •
- •
- •
🔗 您可能感兴趣
- •
- •
- •
- •
- •
- •
🔐
请登录后参与评论
注册满12小时后评论,即可解锁附件下载
立即登录