MetaTrader 4 的 CCI 背离指标下载 – 免费 – [TFlab] | CCI Divergence Indicator for MetaTrader 4 Download – Free – [TFlab]

2025年6月22日,在版本2中,该指标添加了警报/通知功能
The CCI 背离指标 is an efficient tool within the MetaTrader 4 振荡器,旨在检测price divergences and identify 超买和超卖情况.
该工具基于商品通道指数 (CCI) 变化 and analyzes 趋势反转点.
在这个振荡器结构中, bullish divergence is marked by an orange line, while bearish divergence表示为pink line, indicating 潜在的价格方向变化.
CCI 背离指标规格
下表总结了该指标的主要特征:
| 指标类别: | MT4 振荡器指标 信号和预测 MT4 指标 交易辅助 MT4 指标 |
| Platforms: | MetaTrader 4 指标 |
| Trading Skills: | Elementary |
| Indicator Types: | 领先的 MT4 指标 反转 MT4 指标 |
| Timeframe: | 多时间框架 MT4 指标 |
| Trading Style: | 当日交易 MT4 指标 |
| 交易工具: | 股票 MT4 指标 远期市场 MT4 指标 股市 MT4 指标 加密货币 MT4 指标 外汇 MT4 指标 |
Indicator Overview
The 背离线与超买和超卖区域的组合 in the CCI 背离指标 allows for 早期趋势变化检测.
- CCI above +100: 市场进入overbought zone, signaling a 潜在的价格调整 or the 看跌趋势的开始
- CCI below -100: Indicates an oversold condition, warning of a bullish reversal and a possible uptrend
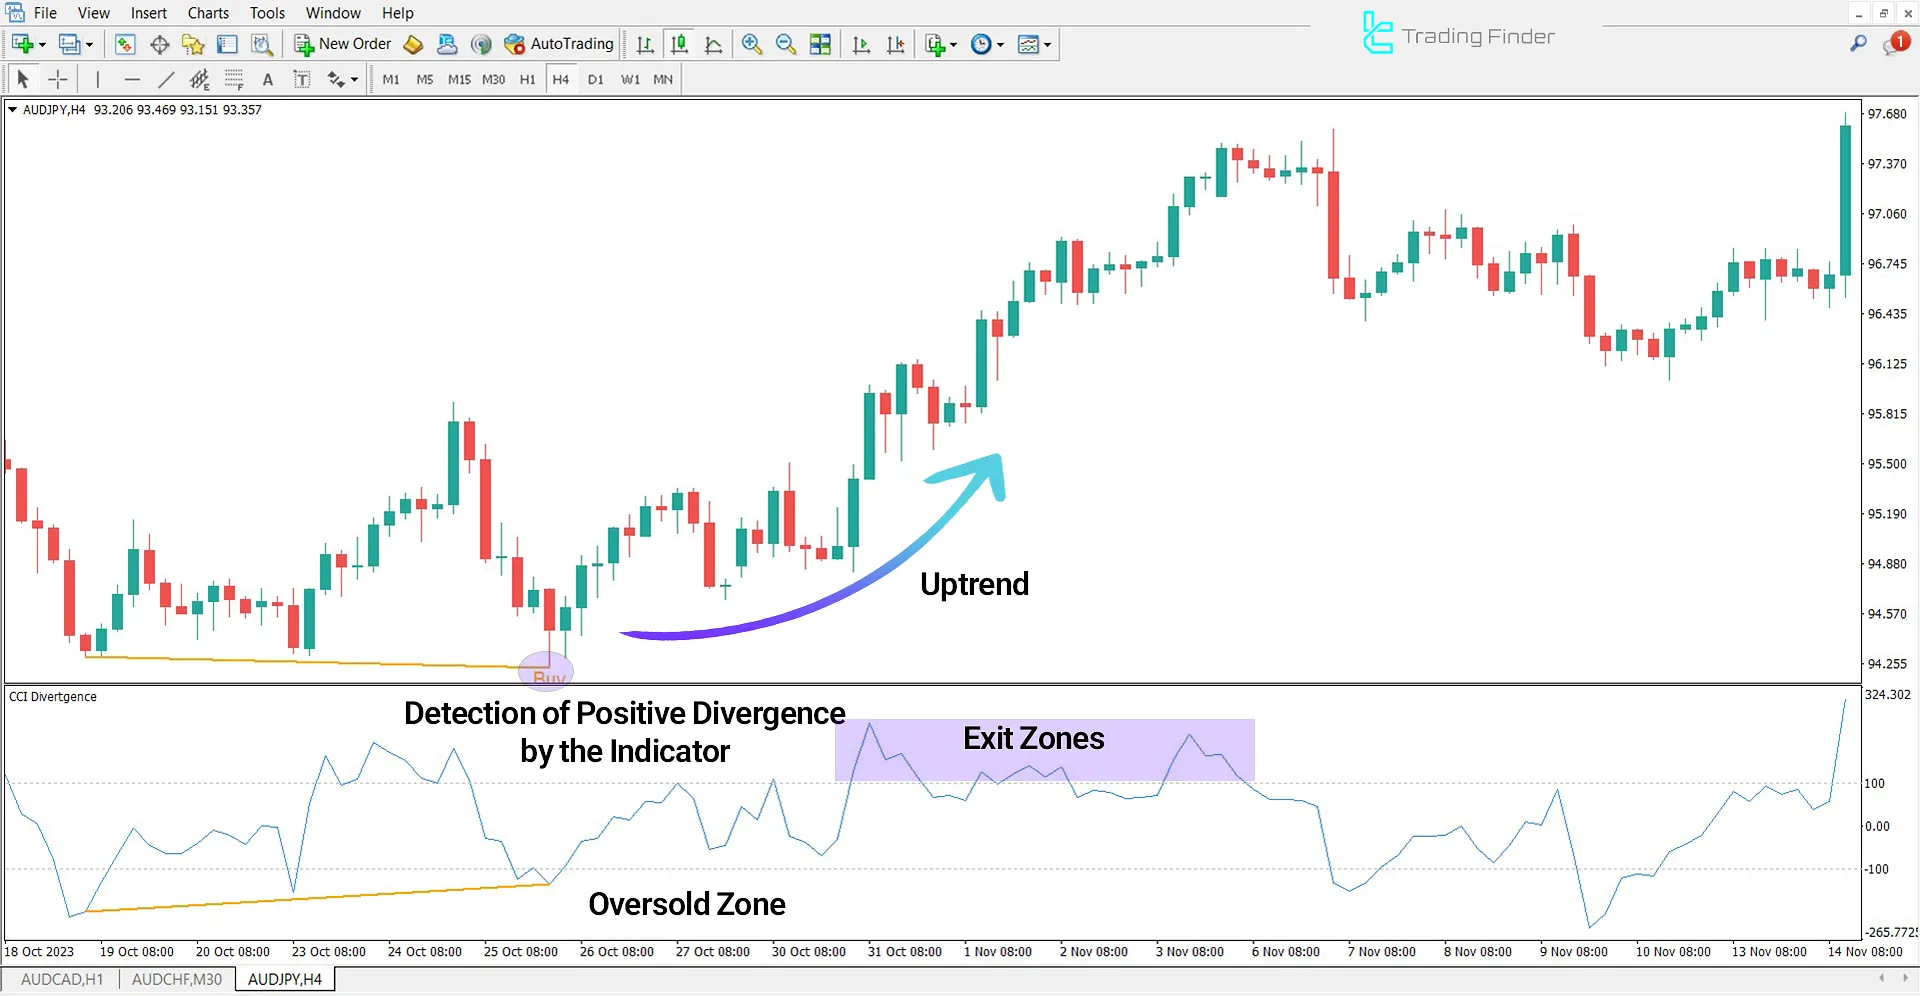
指标处于上升趋势
In the 4小时澳元/日元图表, the CCI 背离指标 identifies a divergence and plots a buy signal line.
交易者可以在以下情况下确认此信号: CCI 跌破-100. A 跌破该水平并随后反弹 strengthens the buy signal.
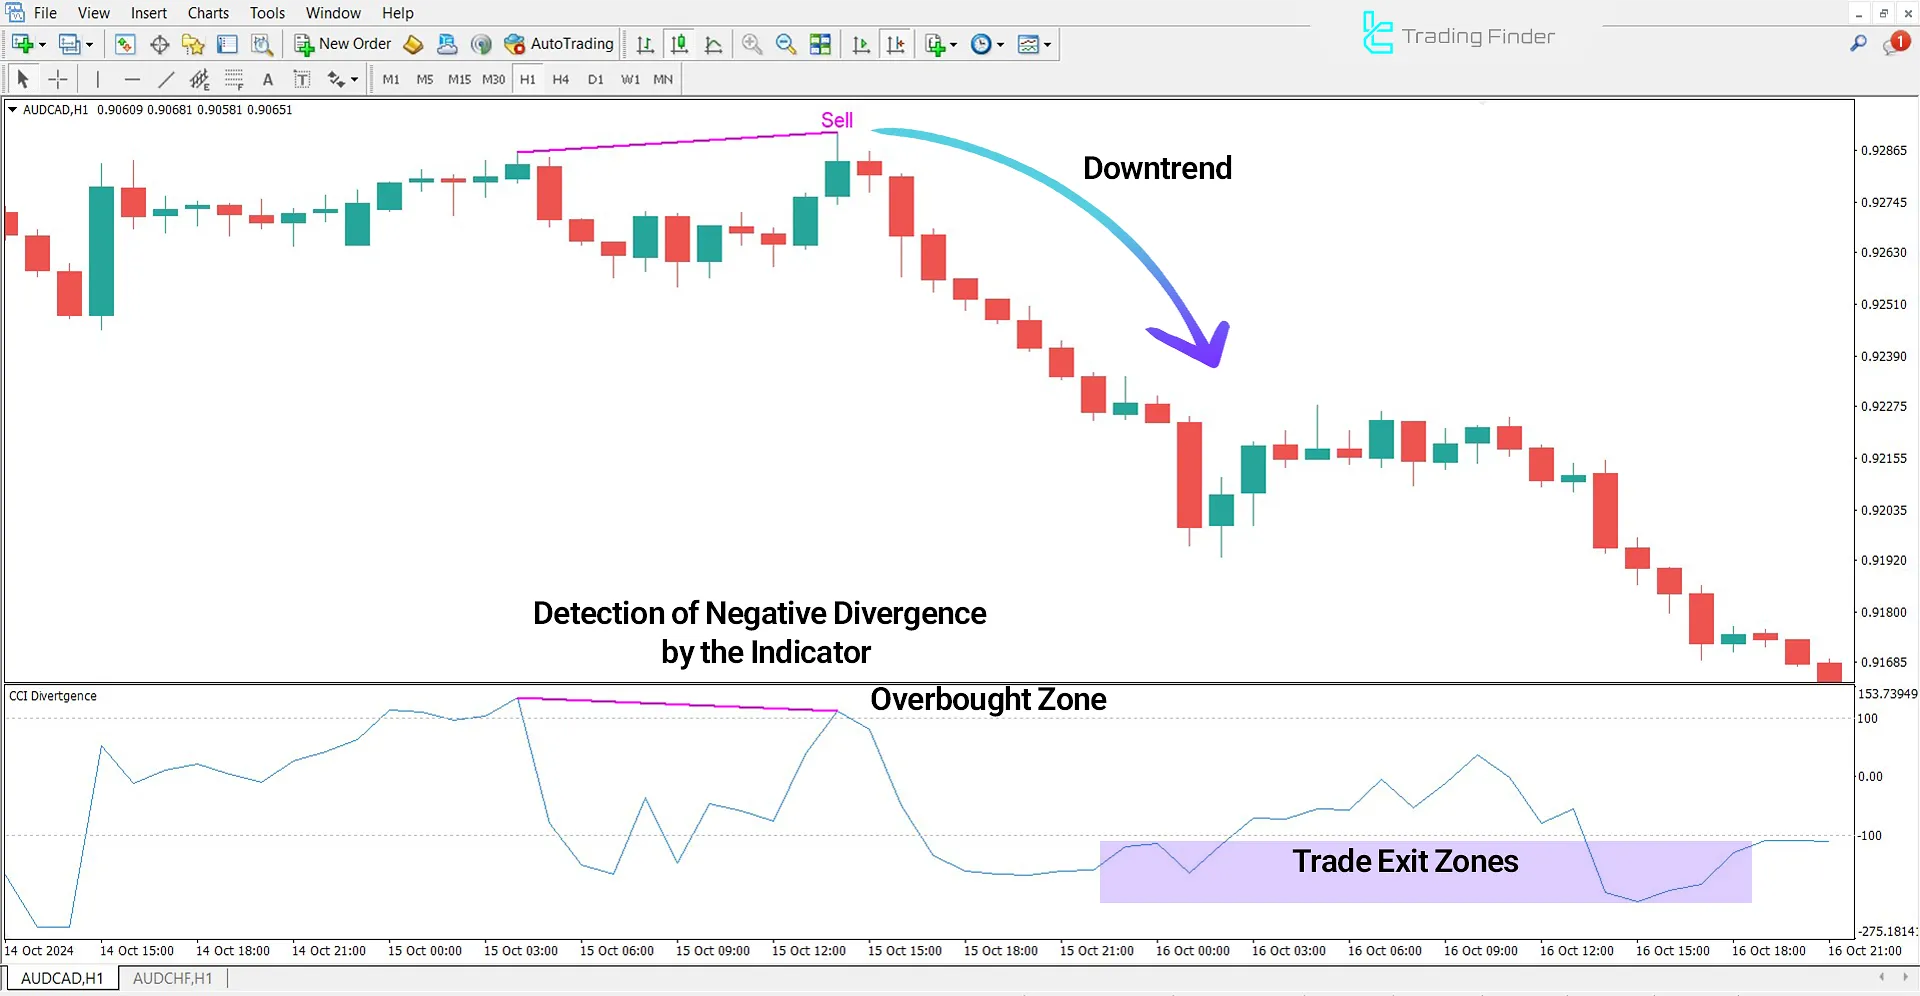
指标处于下降趋势
In the 1小时澳元/加元图表, the CCI 背离指标 identifies price divergence and marks it with a pink line.
If CCI 跌破 -100, it signals an 超买状态,表明潜在的价格停滞或看跌修正的开始。
CCI 背离指标设置
The settings panel该指标如下图所示:
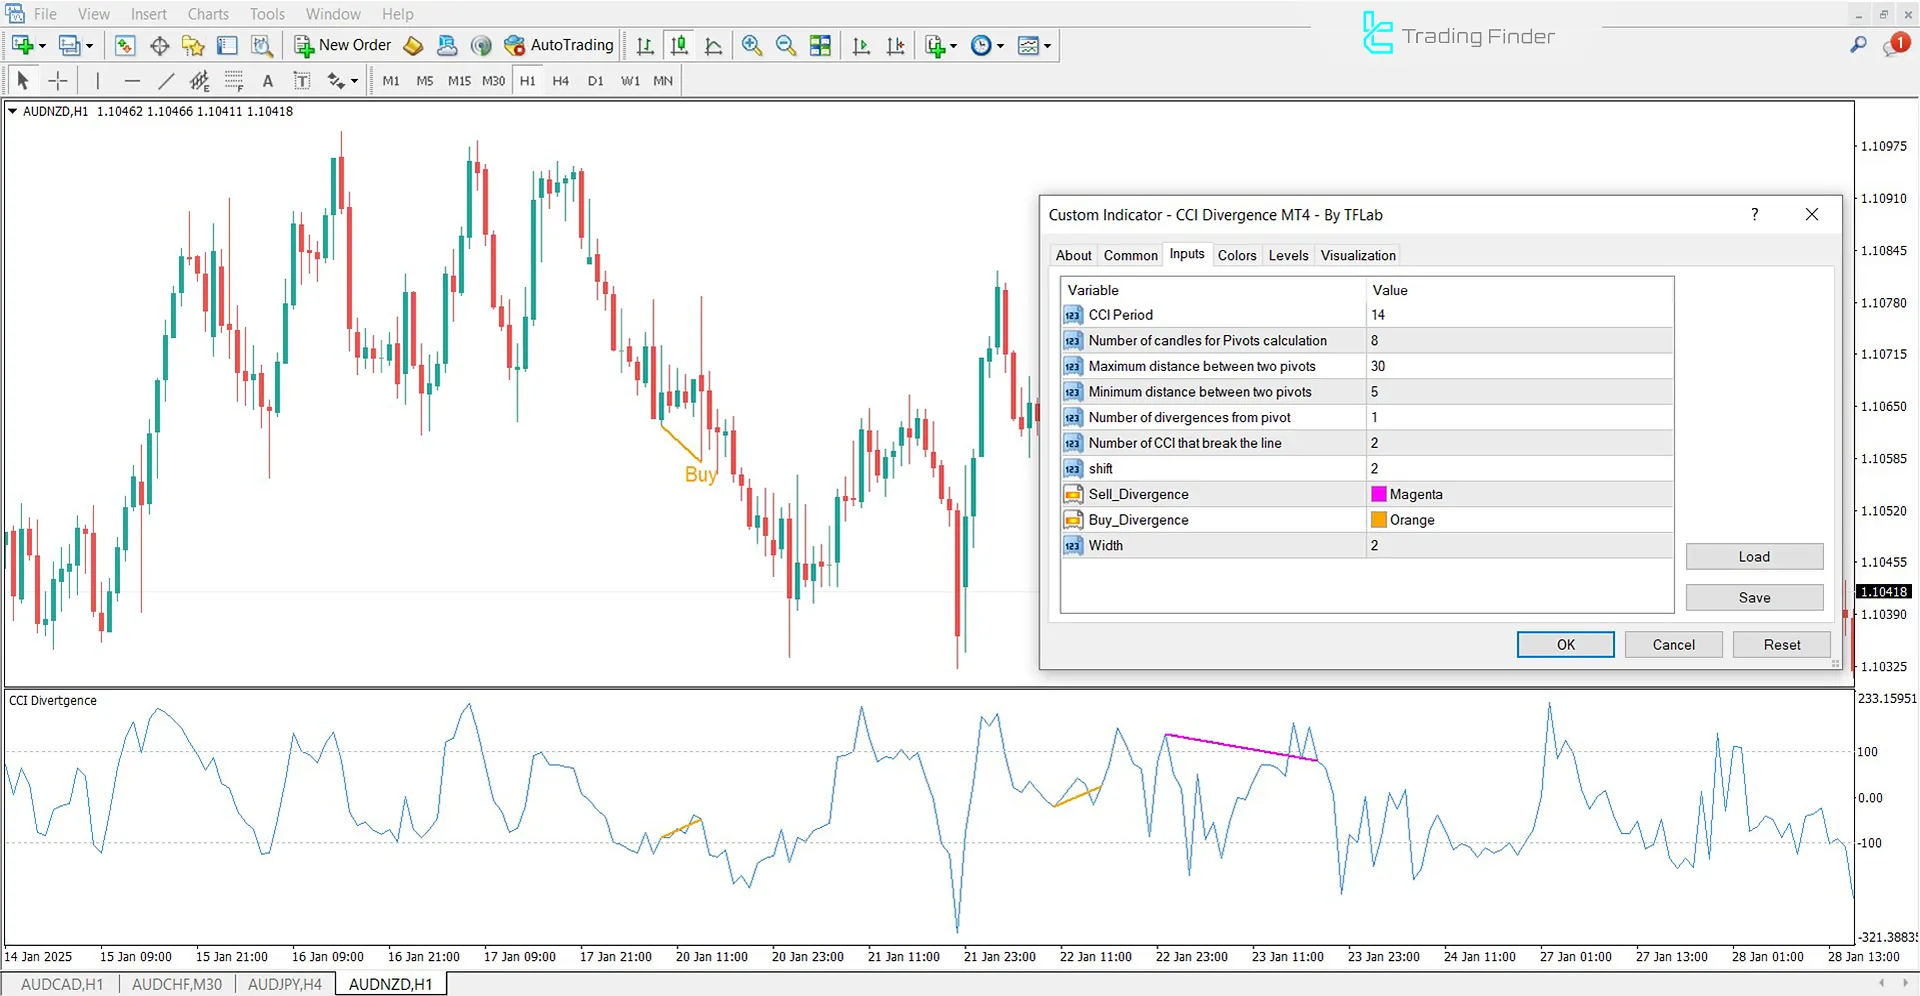
- CCI Period:定义 CCI 的计算周期
- 用于枢轴计算的蜡烛数量:指定用于枢轴计算的蜡烛数量
- 两个枢轴之间的最大距离:设置枢轴之间的最大距离
- 两个枢轴之间的最小距离:定义枢轴之间的最小距离
- 与枢轴的分歧数:确定从主元中识别出的背离数
- 突破线的 CCI 数量:指定确认背离所需的 CCI 中断次数
- Shift:调整价格偏移值
- Sell Divergence:定义卖出背离信号的颜色
- Buy Divergence:定义买入背离信号的颜色
- Width:调整发散线的粗细
Conclusion
The CCI 发散振荡器是一个旨在identify 超买区和超卖区 and detect price divergences.
This MetaTrader 4 信号和预测指标, by combining 超买和超卖情况下的背离信号,允许交易者分析潜在的趋势变化并识别市场反转点。
📦 下载附件 / Download Files
💡 精彩内容推荐
✍️ 楼主最新发布
- •
- •
- •
- •
- •
- •
🔗 您可能感兴趣
- •
- •
- •
- •
- •
- •
