MetaTrader 4 的隐藏缺口成交量指标下载 | Hidden Gap Volume Indicator for MetaTrader 4 Download

The 隐藏缺口成交量指标在 MetaTrader 4 平台中首先计算最后 20 根蜡烛的平均成交量, then draws 振荡条周围的带 based on 两个标准差.
接下来,振荡器中的每个交易量条根据与先前交易量和偏差带的比较进行分类,并以特定颜色显示:
- Red: the bar with the lowest volume within the range
- Yellow: Volume is 低于前一根蜡烛
- Purple: volume is 低于前两根蜡烛
- Blue: Volume is 高于前一根蜡烛
- Brown: volume bars that 超过偏差带
- Green: bars that exceed the band but have 成交量低于前一柱
隐藏间隙体积规格表
下表展示了隐藏缺口成交量指标:
| 指标类别: | MT4 交易量指标 MT4 振荡器指标 烛台 MT4 指标 |
| Platforms: | MetaTrader 4 指标 |
| Trading Skills: | Intermediate |
| Indicator Types: | 趋势 MT4 指标 反转 MT4 指标 |
| Timeframe: | 多时间框架 MT4 指标 |
| Trading Style: | 日内 MT4 指标 |
| 交易工具: | 股票 MT4 指标 指数市场 MT4 指标 商品市场 MT4 指标 股市 MT4 指标 加密货币 MT4 指标 外汇 MT4 指标 |
Indicator Overview
In the 隐藏缺口成交量指标, yellow and purple bars indicate 成交量确认疲软(隐藏缺口)沿趋势方向。Brown bars detect 超买或超卖区域.
这种颜色编码可以帮助交易者快速识别弱势趋势 and potential reversal zones,更容易定义进入和退出水平 for trades.
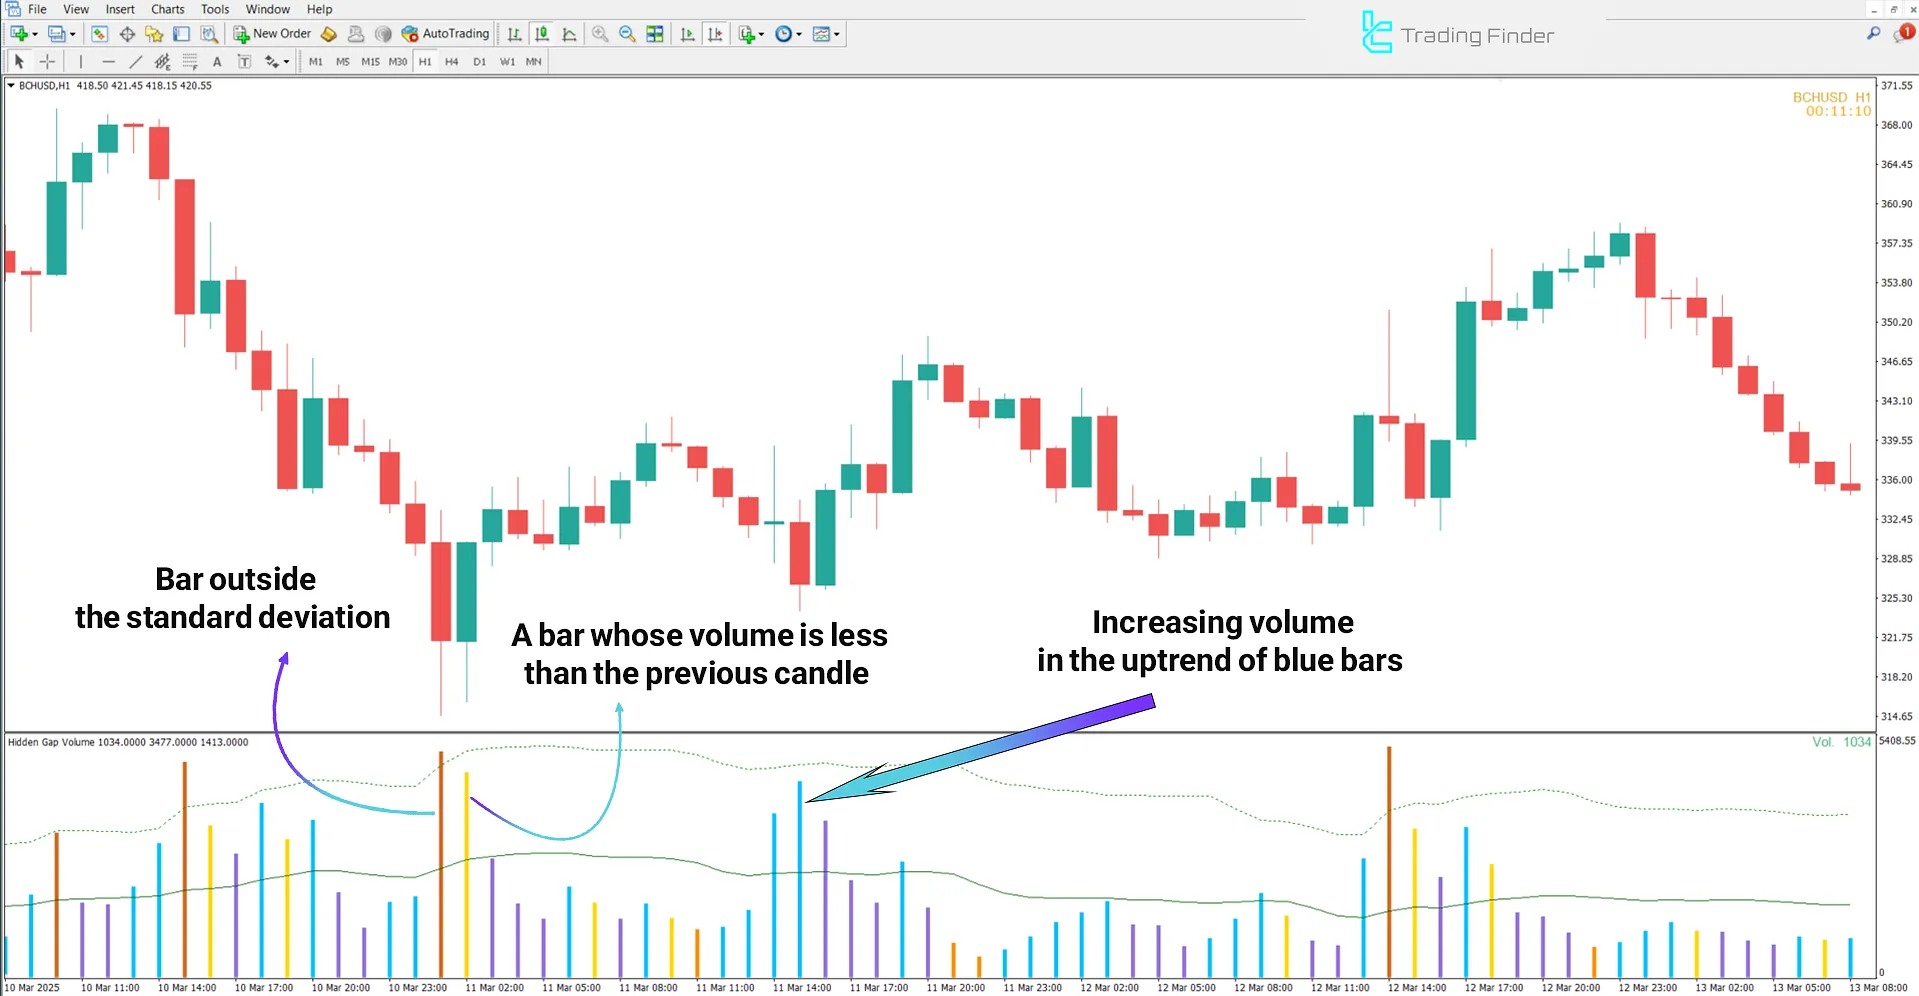
Uptrend Conditions
下图显示了比特币现金(BCH/美元) pair on the 1-hour timeframe。 在上升趋势中,出现blue bars indicates strong buying power.
然而,如果形成新的高价并且成交量柱转向 yellow or purple, a hidden gap存在,意味着价格上涨但成交量不匹配,表明超买条件.
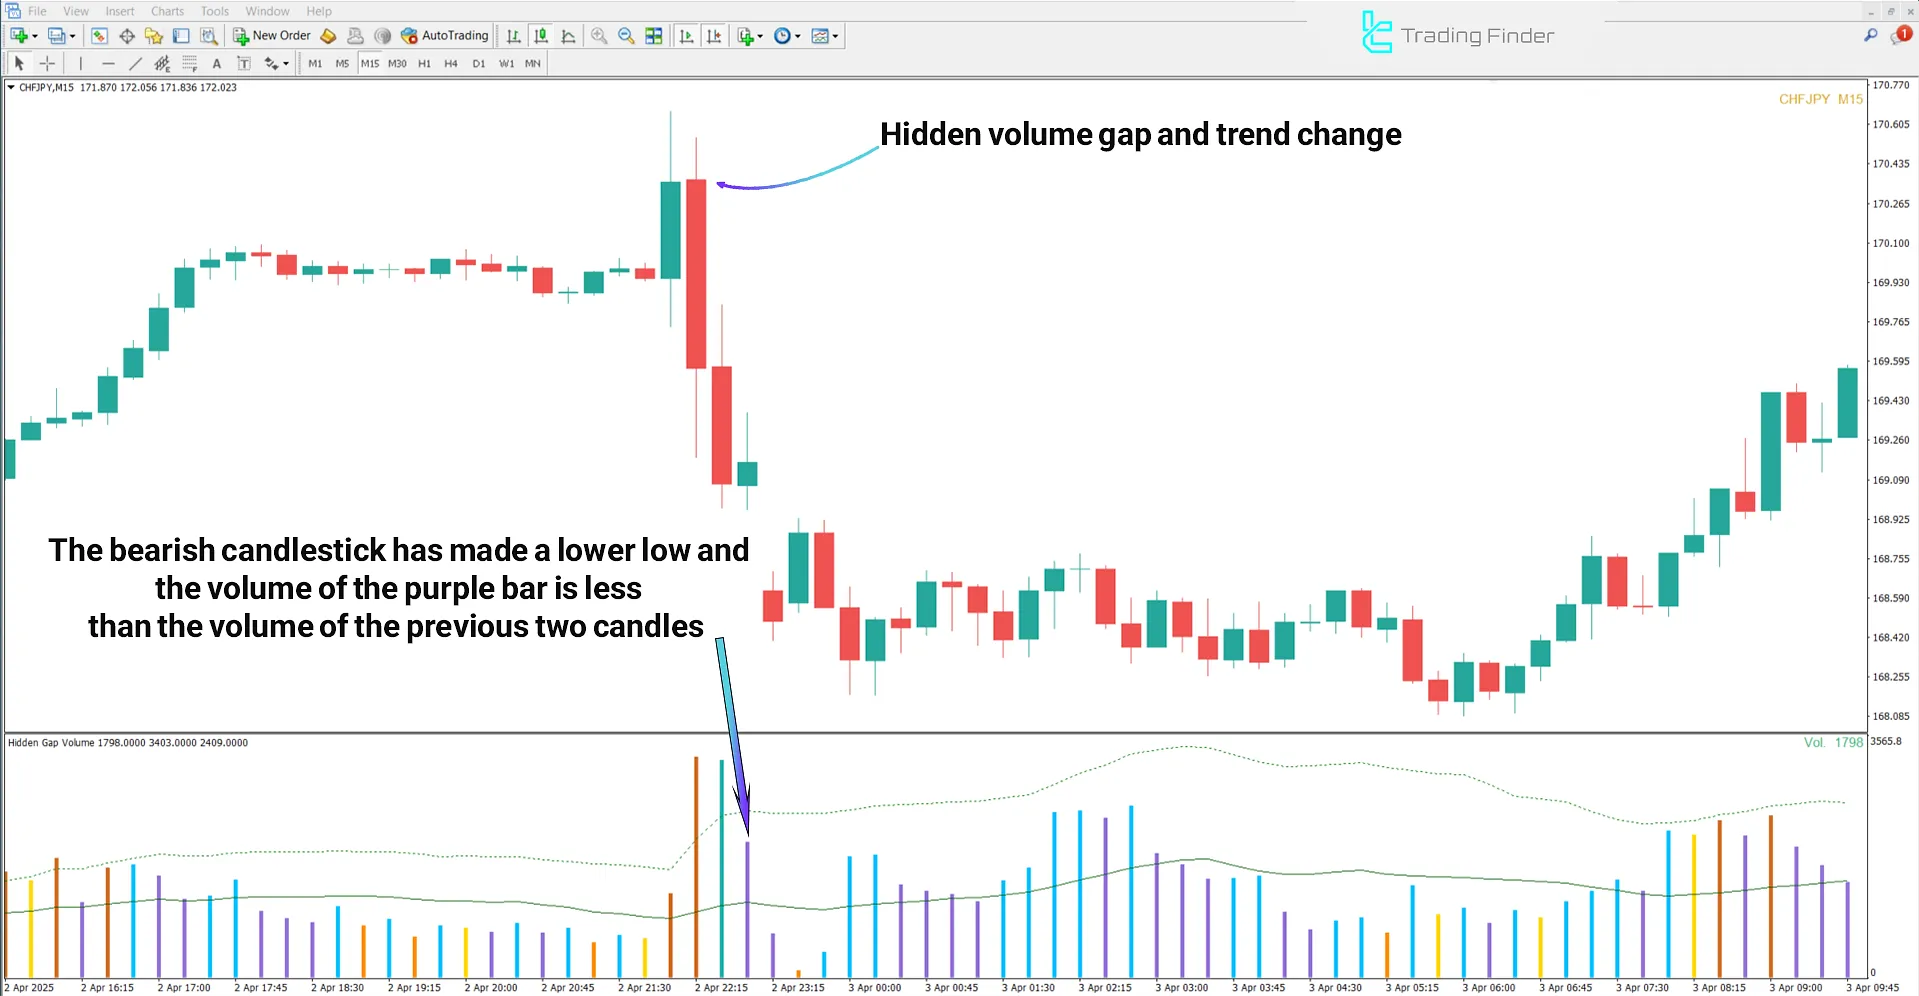
下降趋势条件
下图显示了CHF/JPY上的货币对15-minute timeframe. Blue bars signal 强烈的抛售压力并有可能在下降趋势中继续下降。
如果价格创出新低并且紫色和黄色音量条显示比之前一两个柱更低的值,abullish hidden gap形成,表明潜在趋势反转向上.
隐藏缺口成交量指标设置
指标设置面板Hidden Gap Volume 如下图所示:
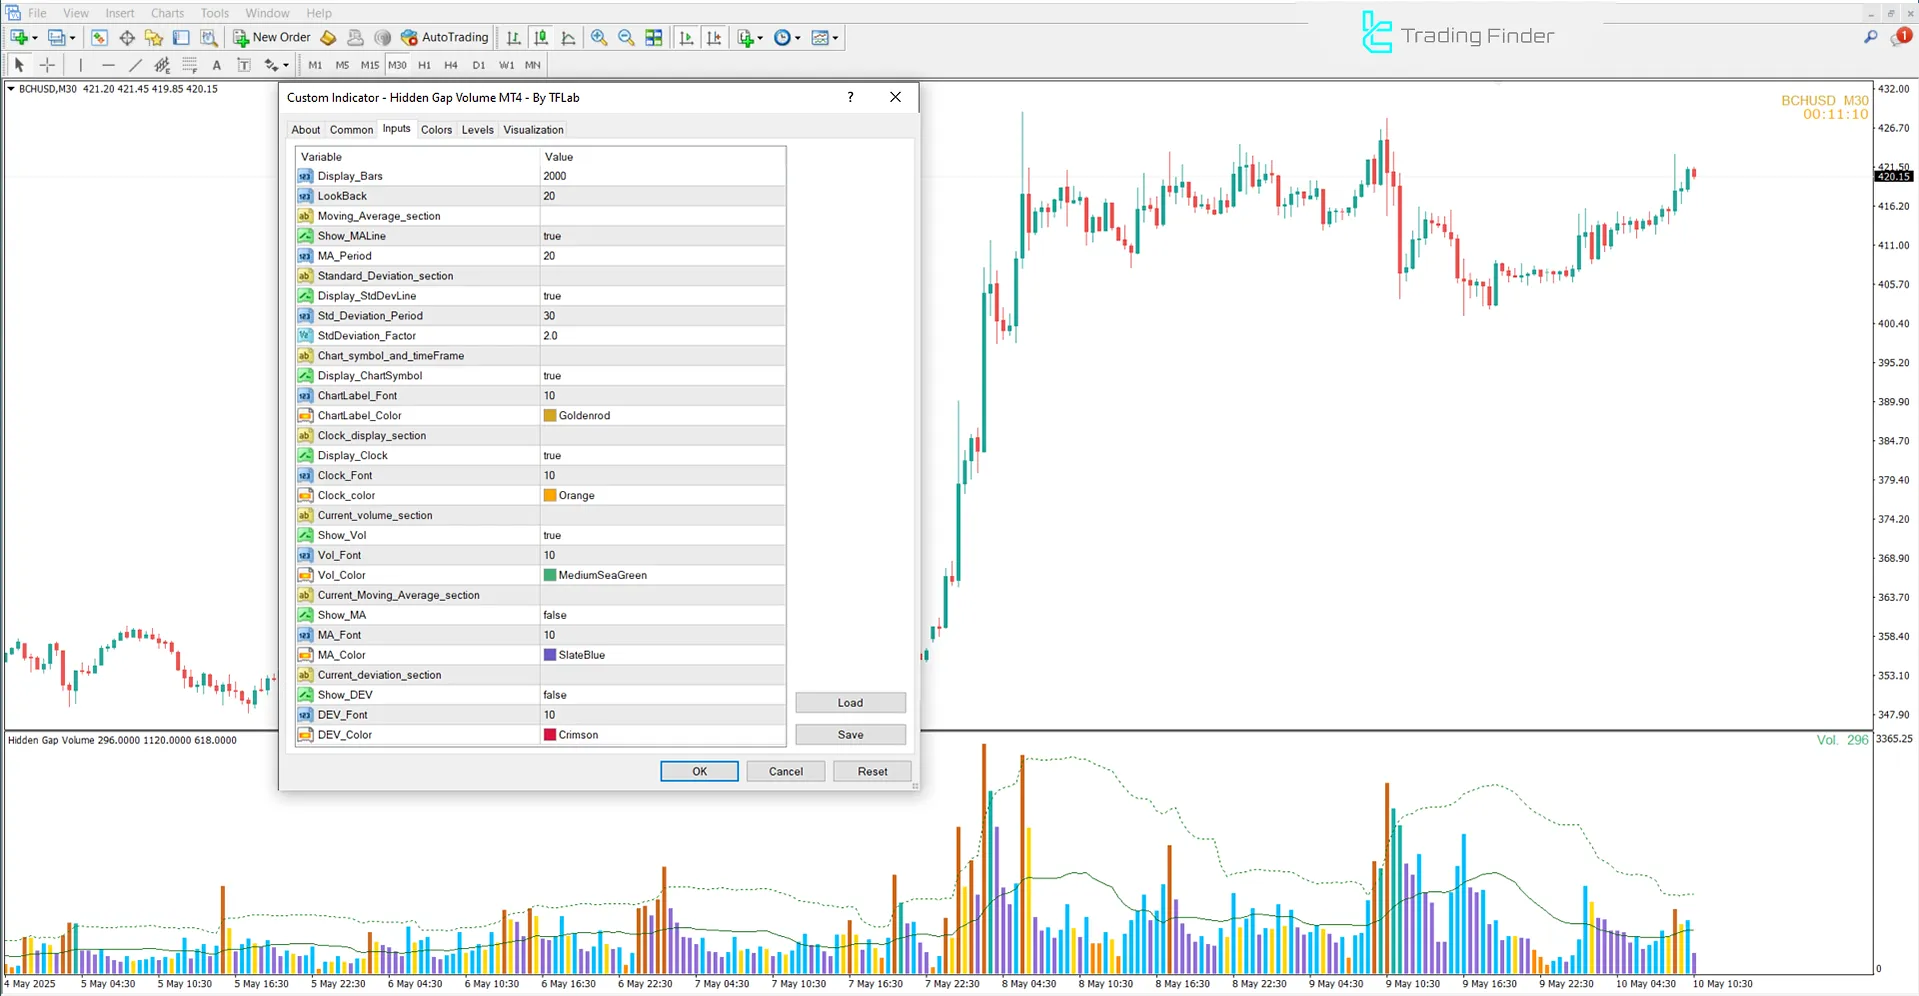
- Display Bars:图表上显示的蜡烛数量
- Look Back:用于计算的回顾期
- Show MALine:启用移动平均线显示
- MA Period:移动平均线窗口的长度(周期)
- Display StdDevLine:显示标准差边界线
- 标准偏差周期:用于计算标准差的周期
- StdDeviation Factor:标准差阈值的乘数
- Display ChartSymbol:显示图表符号和时间范围标签
- ChartLabel Font:交易品种/时间范围标签的字体大小
- ChartLabel Color: Label color
- Display Clock:启用屏幕时钟
- Clock Font:数字时钟的字体大小
- Clock color: Clock font color
- Show Vol:显示实时音量
- Vol Font:卷文本的字体大小
- Vol Color: 亮度显示颜色
- Show MA:显示当前MA值
- MA Font:当前 MA 显示的字体大小
- MA Color:MA值的显示颜色
- Show DEV:显示当前偏差值
- DEV Font:偏差标签的字体大小
- DEV Color:偏差值的颜色
Conclusion
The Hidden Gap Volume trading tool, by identifying 成交量确认的弱点(黄色条)在顶部和底部以及点状体积饱和区(棕色条),提供精确的进入和退出区域 for trades.
📦 下载附件 / Download Files
💡 精彩内容推荐
✍️ 楼主最新发布
- •
- •
- •
- •
- •
- •
🔗 您可能感兴趣
- •
- •
- •
- •
- •
- •
